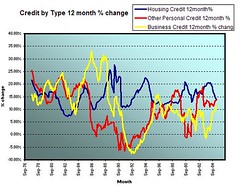
Here is the graph I was talking about earlier. It shows the credit growth by broad type (RBA defined).
It is current up to March 2005.
The most interesting info is the fact that housing credit has never been below 10% the start of 1984!!
When I upload the total credit, you will see what 20 years of compounding more than 10% does.
Housing affordability eh :)
Have Fun
Subscribe to:
Post Comments (Atom)

No comments:
Post a Comment